As a technology enthusiast navigating the ever-evolving tech landscape, I’ve come to appreciate the power of data-driven decision-making. Over the past few quarters, I’ve focused on honing my team’s performance by tracking specific KPIs that have proven invaluable. From this experience, I’ve identified three essential KPIs that I found particularly interesting and believe every engineering leader should consider prioritizing. These KPIs have not only guided my strategic decisions but have also helped level up the overall experience within the engineering team. By sharing my journey and insights, I hope to offer a practical framework for those looking to enhance their team’s visibility and effectiveness.
1. KPIs for Investment: Allocation
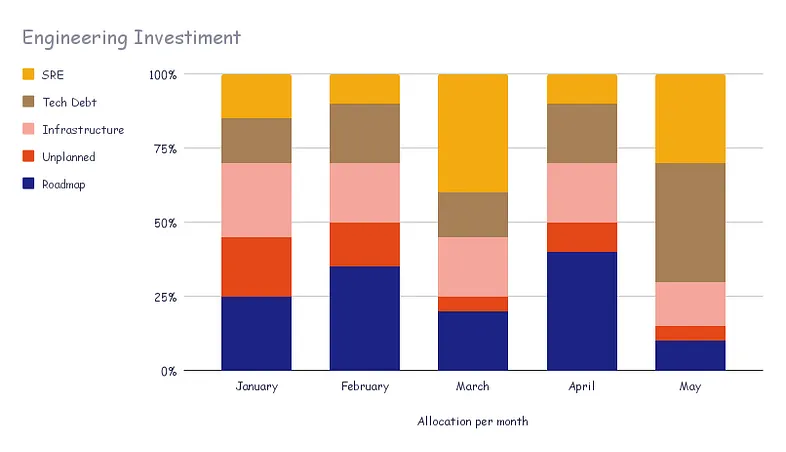
It’s crucial to understand how your team’s efforts are currently split and how much capacity they have to take on new initiatives. Diving into resource allocation allows you to visualize your team’s work across innovation, infrastructure, and tech debt, ensuring that investments align with strategic objectives. By doing so, you will be empowered to make informed decisions about prioritizing efforts that deliver the most value to your roadmap. To illustrate this, I’ve included a mock graph that visually represents how allocation could be laid out.
Visualizing Resource Allocation Across Projects
2. KPIs for Quality: Uptime
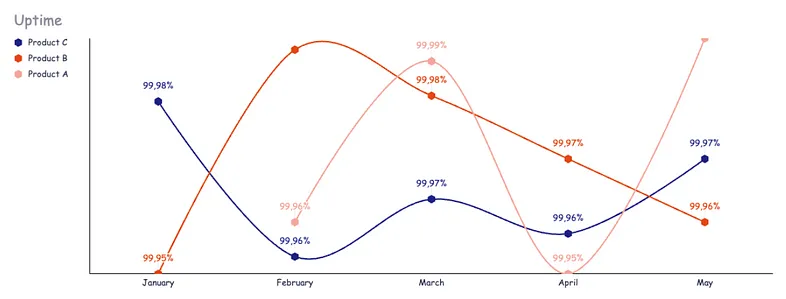
Once you know your team is building the right features and they are focused, it’s important to ensure that the software being developed can consistently provide the expected value. Uptime has been a pivotal metric in this quest. It will allow you to monitor your offerings’ reliability, minimize disruptions, and maintain user satisfaction. This focus on quality could reinforce your commitment to delivering high-value, dependable services. See below a mock graph to visually represent uptime trends and their impact on service quality.
Monitoring Uptime for Consistent Value Delivery
3. KPIs for Process: Cycle Time and Lead Time
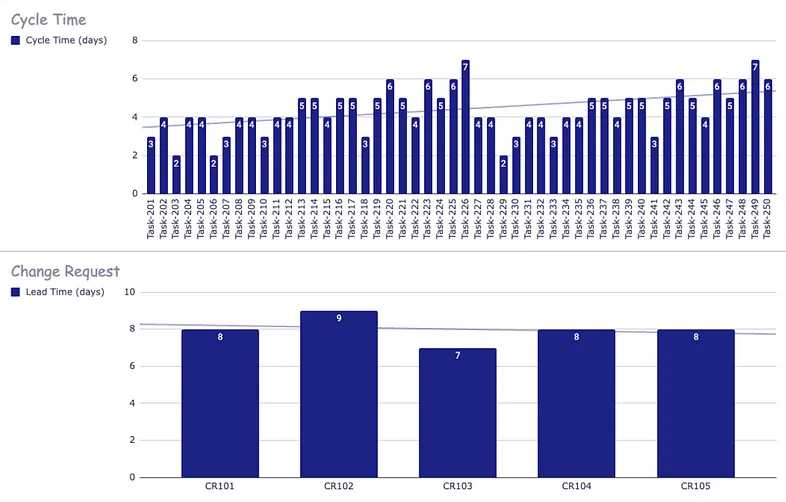
Delivering code faster is a common focus within the tech community, especially when working with agile methodologies. It’s crucial to deliver predictably to set proper expectations, drive alignment across functional teams, and allow for better execution. Cycle time measures the duration from the start to the completion of a task, while lead time, a key metric embraced by DORA (DevOps Research and Assessment group), measures the time from the initiation of a change request to its deployment in production. I use these metrics to identify bottlenecks and streamline processes. They enable me to follow the pace at which you are delivering value. I’ve included a mock graph to illustrate these metrics and their significance in improving your team’s productivity and responsiveness.
Analyzing Cycle Time and Lead Time for Efficient Processes
While there are numerous KPIs to consider, these three have been instrumental in my journey as an engineering leader. I believe they will provide a solid foundation for anyone looking to set up a metrics dashboard or improve their team’s performance visibility. I hope to inspire others to embrace these KPIs and unlock their potential for engineering team success.